A manuscript on the latest version of the tool is under preparation. Link to the same will be provided here once it's published.
Purpose of the tool:
RATE (Restrictor Analysis Tool for Epitopes) is an automated method that can infer HLA restriction for a set of given epitopes from large datasets of T cell responses in HLA typed subjects. The tool takes two data files, one containing the alleles expressed by the subjects and the other containing the response of the peptides in the subjects. The tool calculates the odds ratio and estimates its significance using Fisher's exact test. It also calculates a parameter called relative frequency similar to odds ratio. The tool was developed with a focus on class II alleles but can also be applied to class I alleles.Input data:
- Allele typing data of the subjects: The allele typing data for each subject should be provided in a specific format as a tab delimited plain text file. This can be generated by copying data from a spreadsheet to a plain text file. Instances where the allele type is not known should be represented as 'n/a'.
- Response data: The response data also should be provided in a specific format as a tab delimited plain text file. The file should contain the response data for each peptide in each of the subjects. The absolute values determined by the assay can be entered directly and the threshold for positivity can be provided in the next step or the data can be provided as binary values of 1/0 indicating positive/negative. Instances where the value is not known should be represented as 'n/a'.
- Cutoff for response to be considered positive: This is the cutoff value for the response to determine if a peptide had a positive response in a donor or not. The user can provide the desired cutoff value here if the response data has absolute values from the assay or 1 if it's binary values.
A sample allele data input file can be downloaded from here.
A sample response data input file can be downloaded from here.
Please provide 20.0 as cutoff for the sample files given above.
Result page:
The result page shows:
- Details of input data
- Reformatted allele data showing the list of alleles expressed by the subjects & binary values of their presence/absence in each donor.
- Reformatted response data showing which all peptides gave positive response in each donor as binary values. This will be same as the input response data if it is provided as binary values.
- Details of RATE results
- Link to download RATE results (i.e. the selected HLA allele restrictons)
- Link to download the complete report that shows the analysis results for all peptide-HLA allele combinations. For e.g. if there are 25 peptides and 100 alleles expressed by the subjects, results for 25 x 100 = 2500 peptide-allele combinations are shown.
- Job Id: Please let us know this number if you have any question regarding any task that you did using the tool.
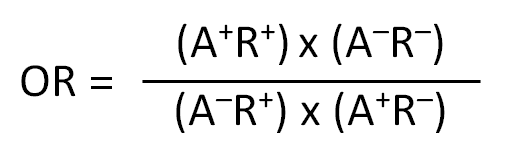
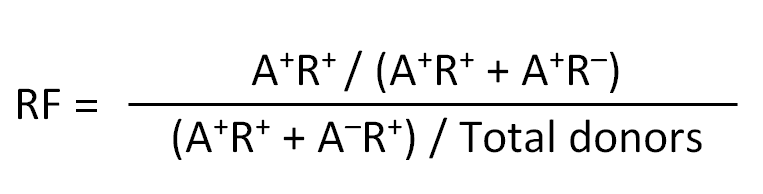
- A+R+: No. of subjects expressing the allele and have a positive response
- A-R+: No. of subjects that do not express the allele but have a positive response
- A+R-: No. of subjects expressing the allele but do not have a positive response
- A-R-: No. of subjects that do not express the allele and do not have a positive response
- No. of subjects: Total no. of subjects for the peptide-allele combination
- Response n/a: No. of subjects where response value is not available
- Odds ratio (OR): OR indicates the strength of association between expression of a specific allele and detection of positive immune response. An OR > 1 indicates a positive association. OR is calculated as:
- Relative frequency (RF): RF can be used in place of OR where OR becomes “infinity” due to division by zero (when none of the donors that do not express the allele have a positive response, i.e. A-R+ = 0). RF is calculated as:
- P-value: P-value obtained from Fisher's exact test can be used as a relative ranking which restriction has most statistical support.
The peptide-allele combinations listed in the "RATE results" file are the inferred HLA restrictions.How the tool works:
The "complete report" shows the analysis results for all peptide-allele combinations.
For each peptide-allele combination, RATE generates a matrix tabulating the number of positive versus negative responders amongst the subjects expressing that particular HLA type, as well as the number of positive and negative responders among the subjects NOT expressing that HLA type. Next, for each epitope RATE calculates the OR and RF corresponding to each of the HLA molecules following classical formulas, as described above. The Fisher’s exact test is used to calculate the significance (p-value) associated with each peptide-allele combination.Previous versions:
The first version of the tool can be accessed here: RATE version-1Note: Please refer the manuscript for more details or contact us at help@iedb.org if you have further questions. Please include the "Job Id" in your correspondence if you have any.